RantCell
CPE Drive Test vs. Smartphone Drive Test
Comparing RantCell Pro and RantCell IoT on the same route, the same day, under the same network conditions.

Why we ran this test
To evaluate how RantCell can measure the real-world performance of a CPE router during drive testing, and compare the results with a conventional smartphone-based RantCell Pro drive test.
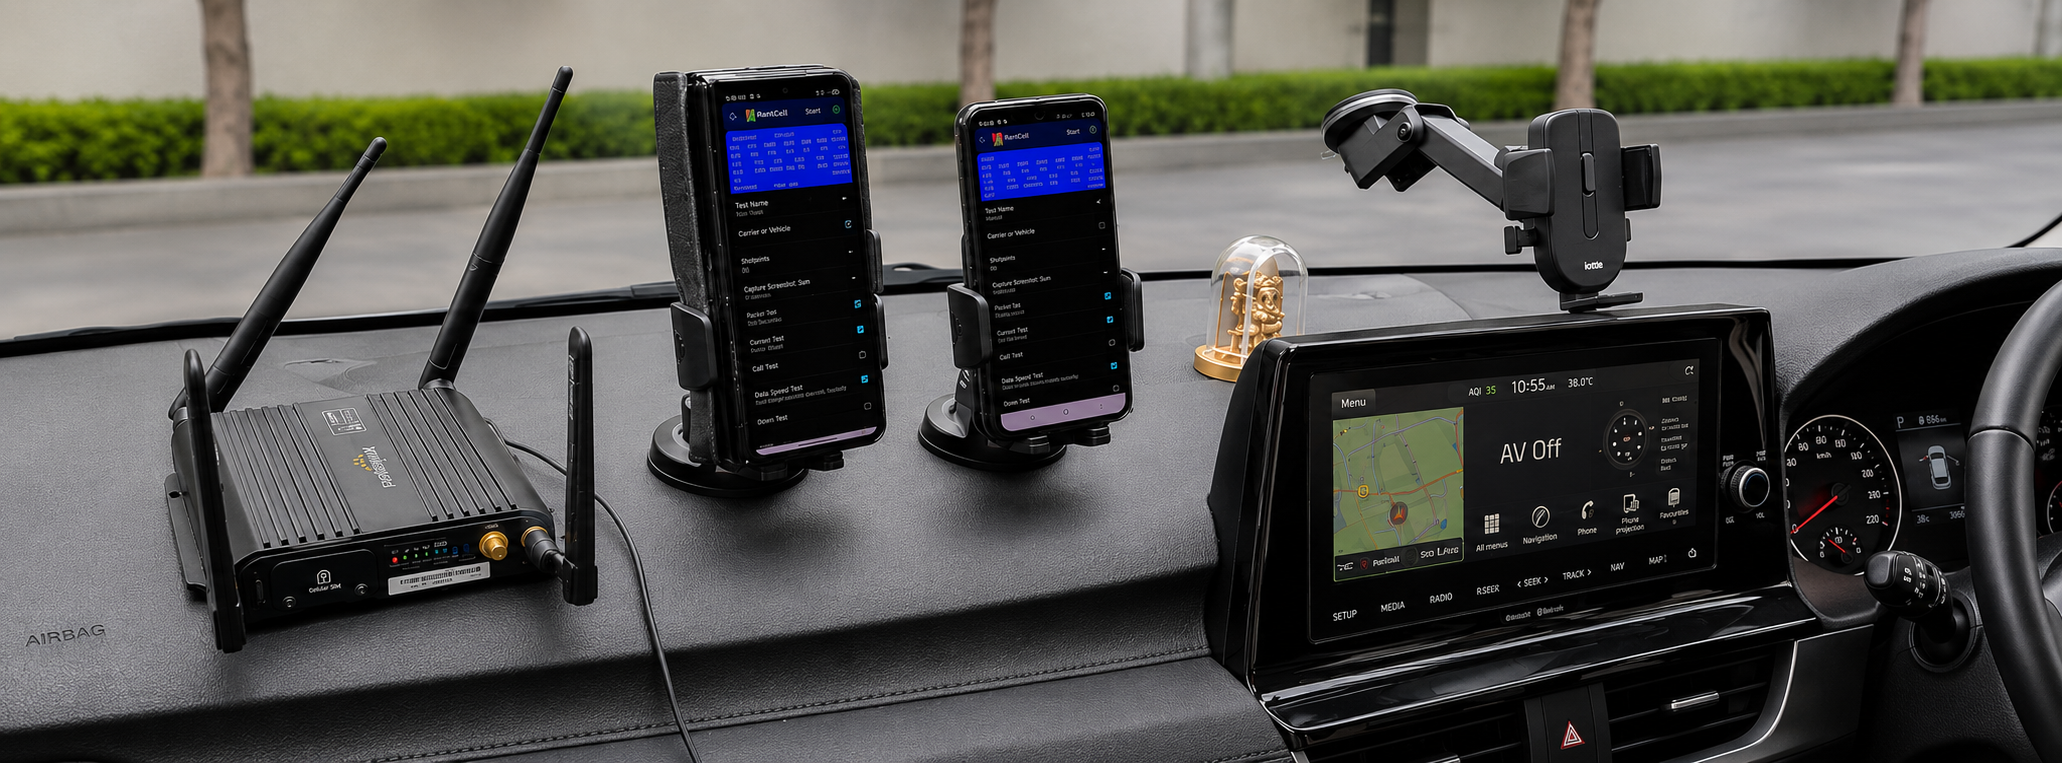
Two setups, one route, seven KPIs
RantCell Pro (smartphone) and RantCell IoT (CPE router) were driven along the same route on the same day, giving a common basis for comparison. Both recorded 100% LTE availability throughout.
Two paths to the same cloud
The smartphone connects directly to the mobile network; RantCell Pro captures RF and performance measurements during the drive.
The CPE router provides the network connection; RantCell IoT captures and reports CPE-based RF and performance measurements.
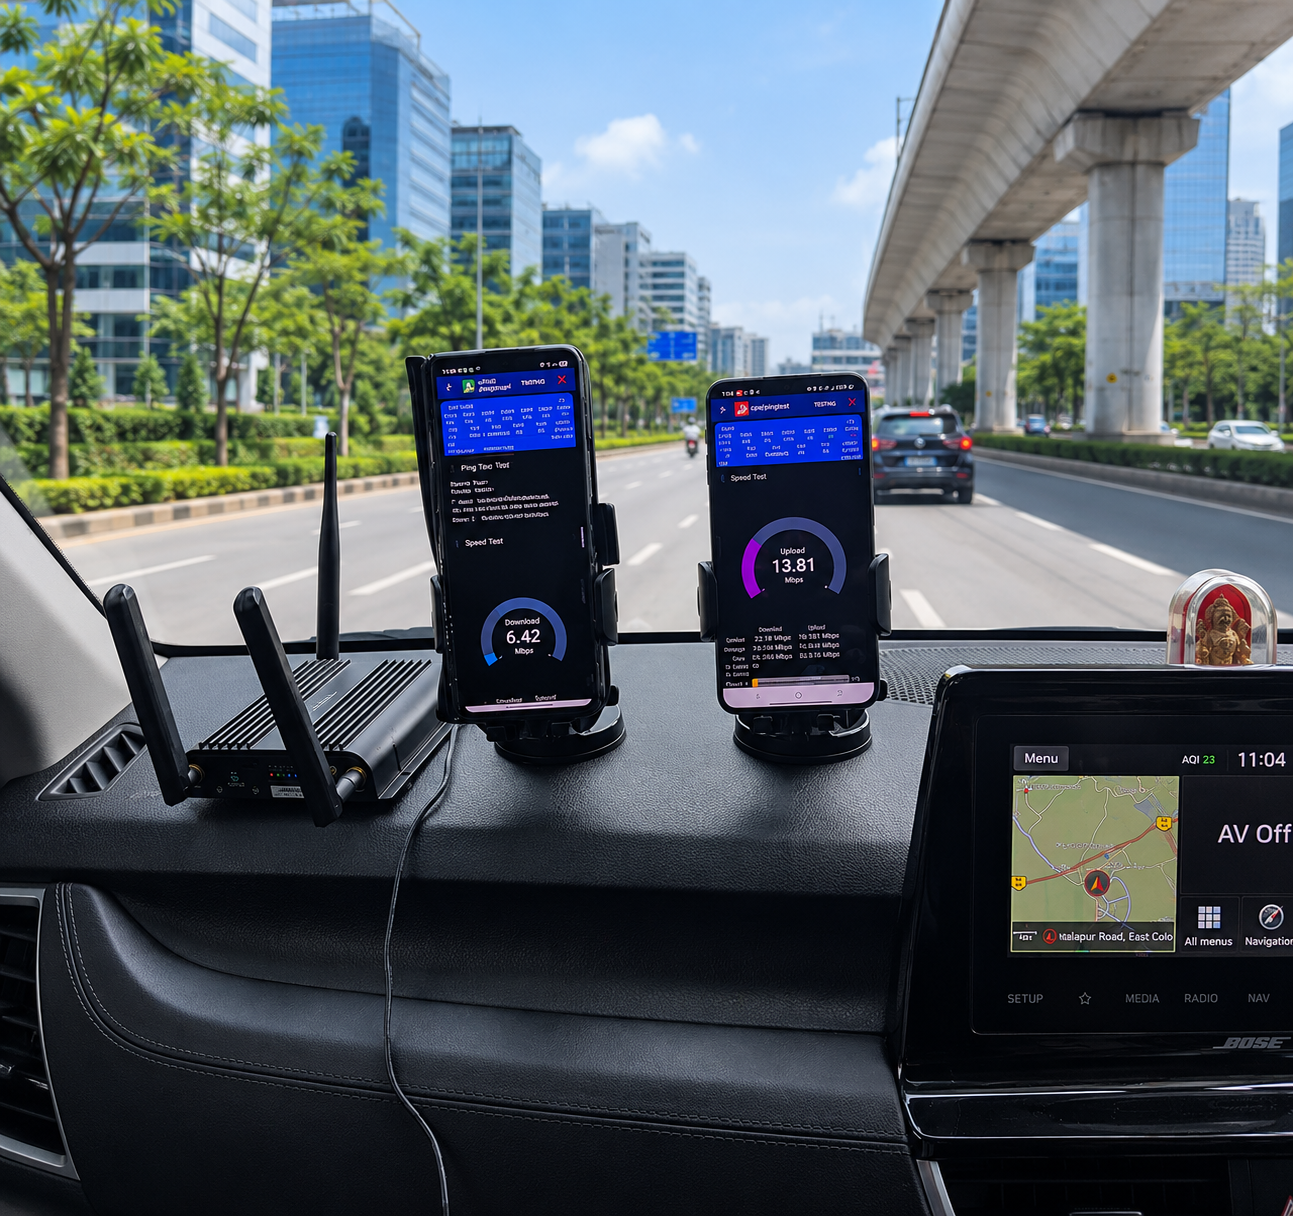
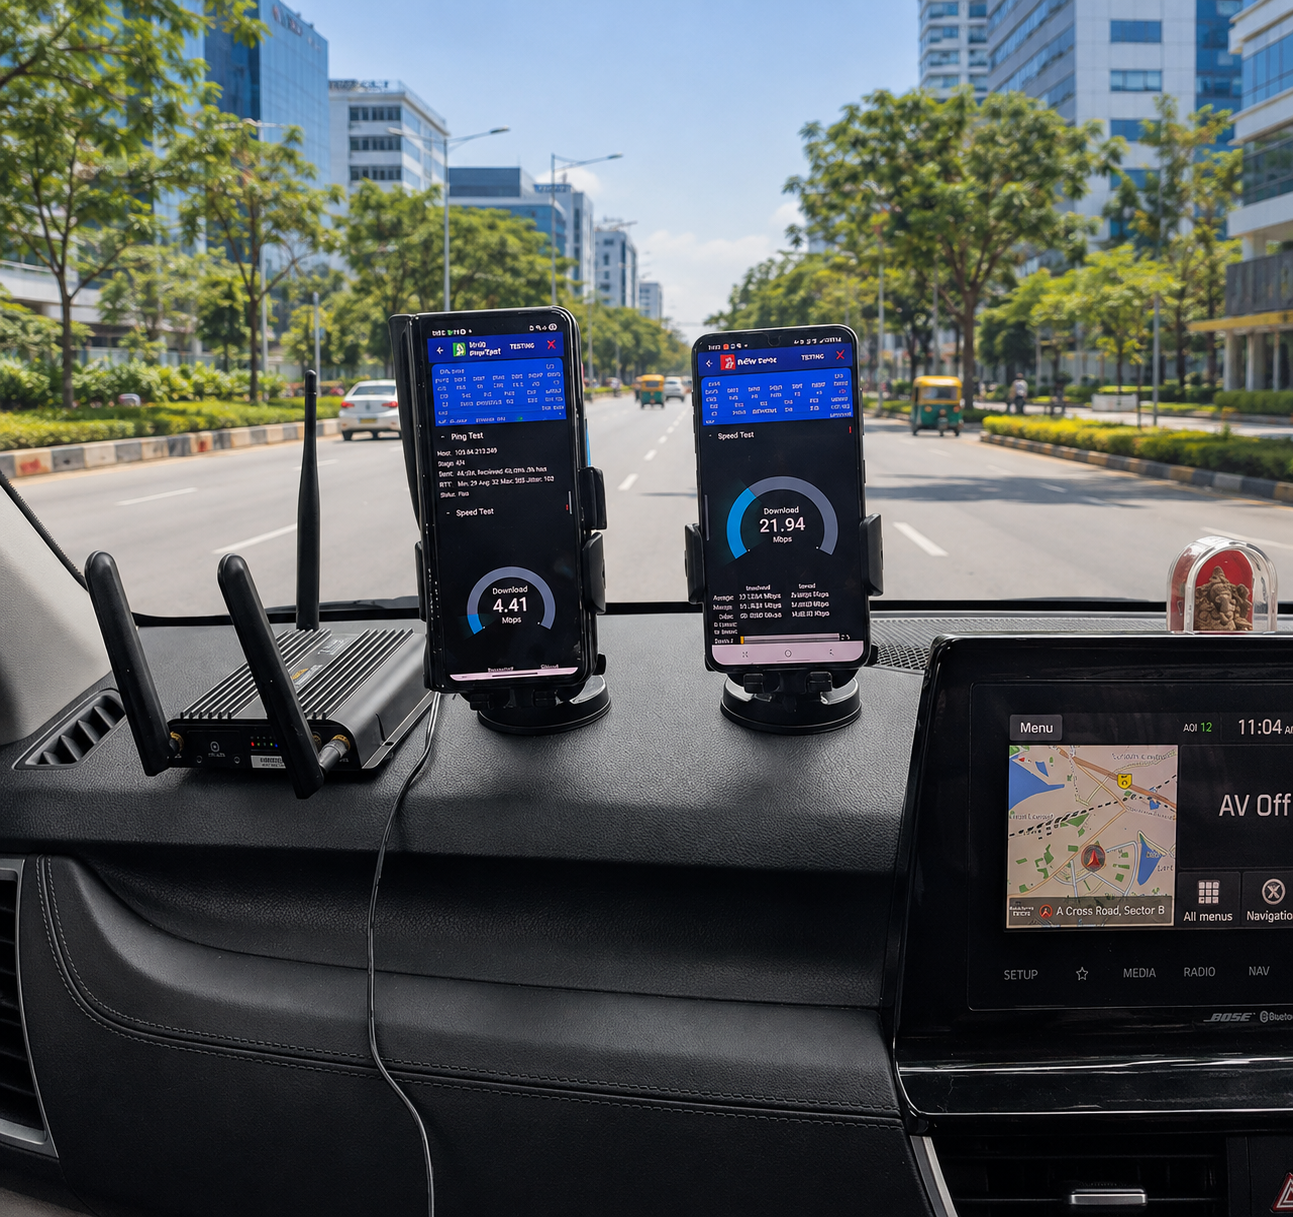
Equipment and in-vehicle placement
Captured live, on the move
RantCell records RF and performance measurements continuously while the vehicle moves through the test route.
Results, KPI by KPI
Eight measurements captured on the same route, the same day.
Network Generation
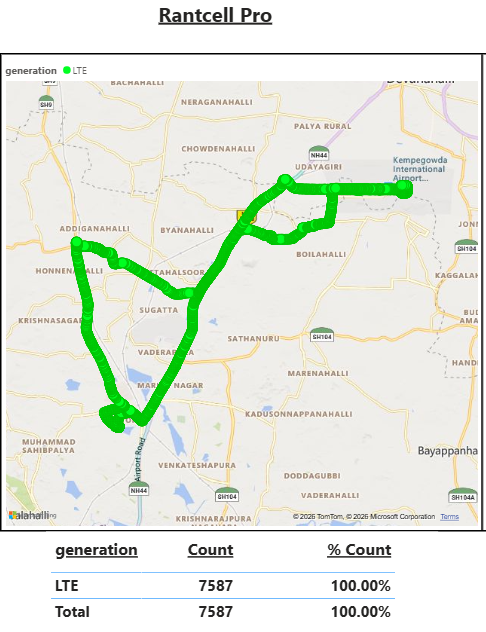
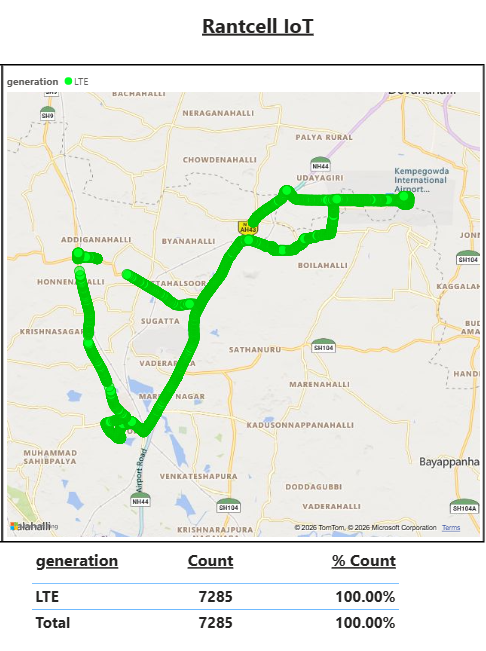
Pro collected 7,587 samples, IoT collected 7,285 — both 100% LTE.
No transition to another network generation was observed on either platform.
Confirms uninterrupted LTE availability across the complete route.
Network Data
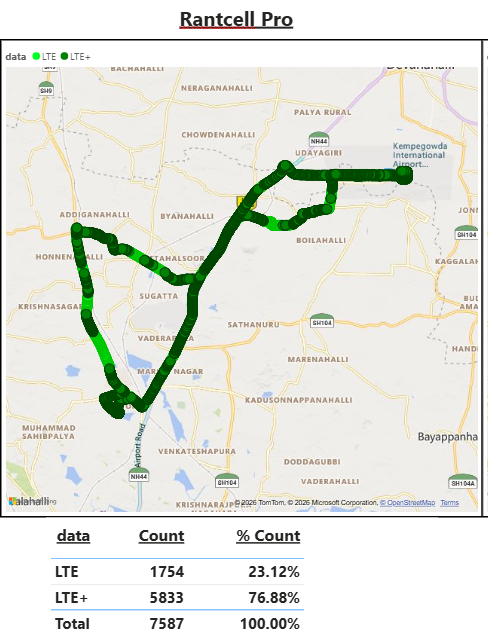
Pro: 76.88% LTE+, 23.12% LTE. IoT: 100% LTE, no LTE+ observed.
Both maintained continuous LTE-family connectivity throughout.
The difference reflects how each platform classifies and reports LTE/LTE+, not a coverage gap.
Signal Strength — RSRP
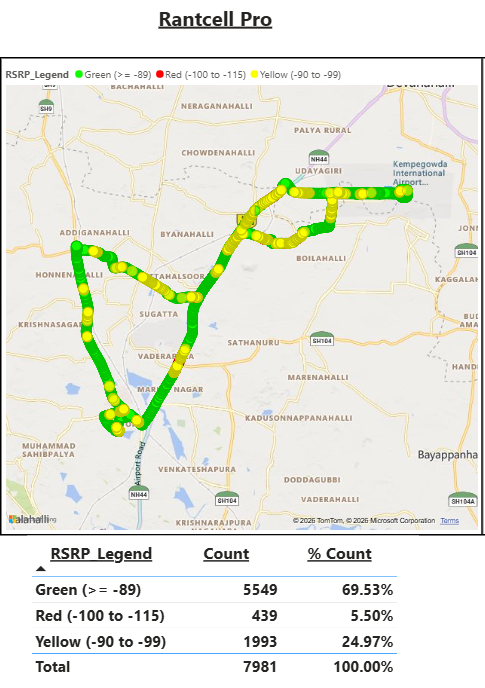
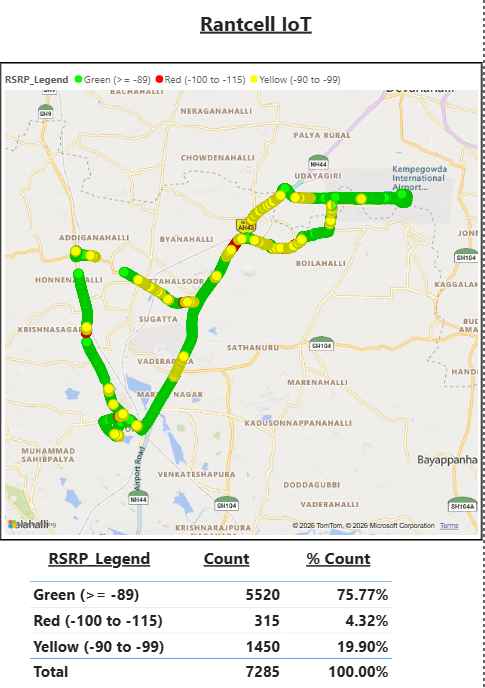
Good RSRP (≥ -89 dBm): Pro 69.53%, IoT 75.77%.
Poor RSRP was low on both: 5.50% Pro, 4.32% IoT.
Both platforms show strong, broadly consistent coverage across the route.
Signal Quality — RSRQ
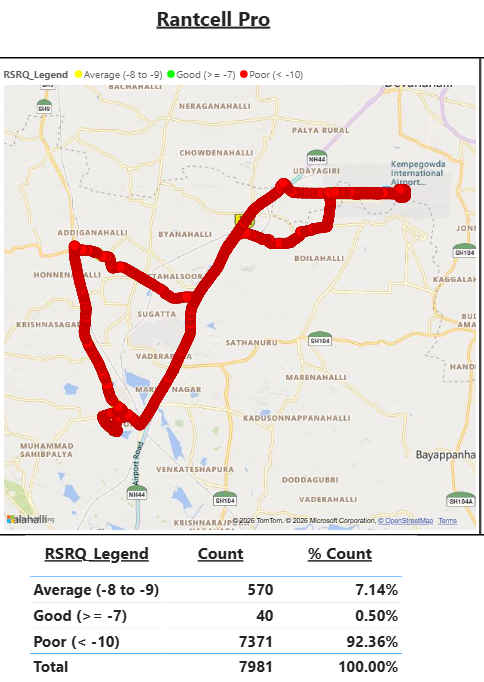
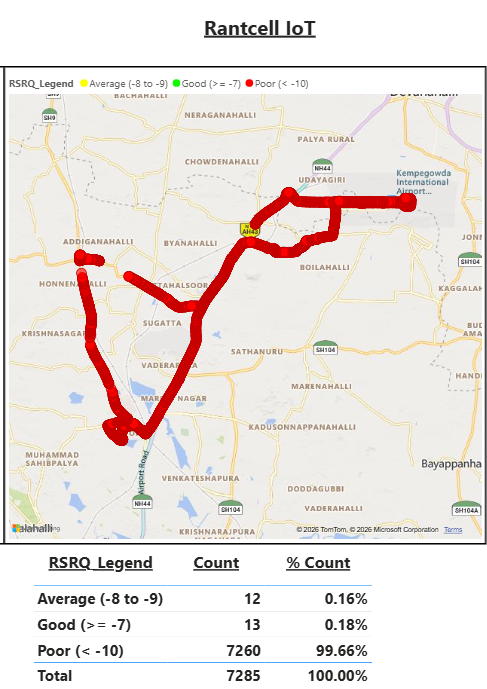
Poor RSRQ (< -10 dB): Pro 92.36%, IoT 99.66%.
Good RSRQ was limited on both: 0.50% Pro, 0.18% IoT.
Both indicate degraded RSRQ conditions, with Pro's distribution relatively better.
Signal-to-Noise Ratio
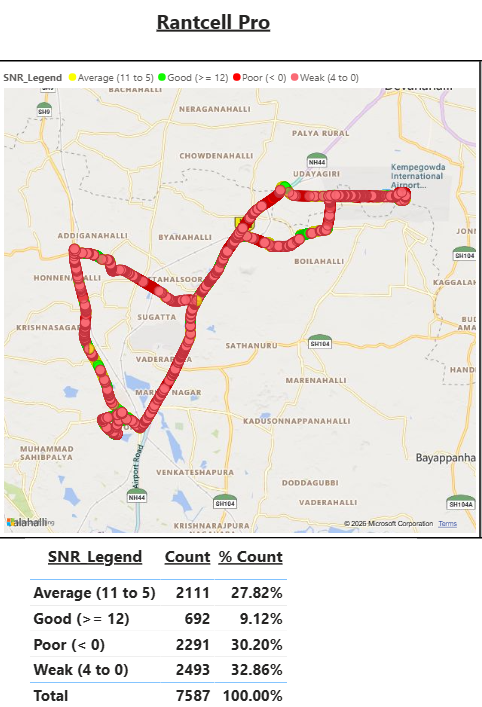
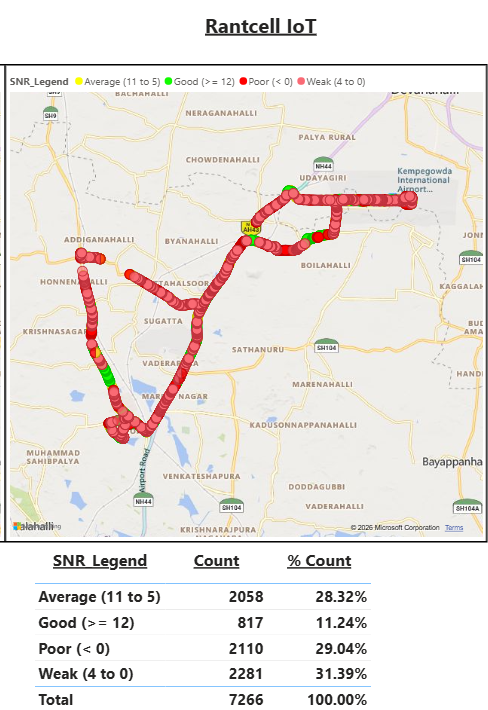
Good SNR (≥ 12 dB): Pro 9.12%, IoT 11.24%.
Poor SNR: 30.20% Pro vs 29.04% IoT.
Weak and Average distributions were closely aligned between both platforms.
Latency
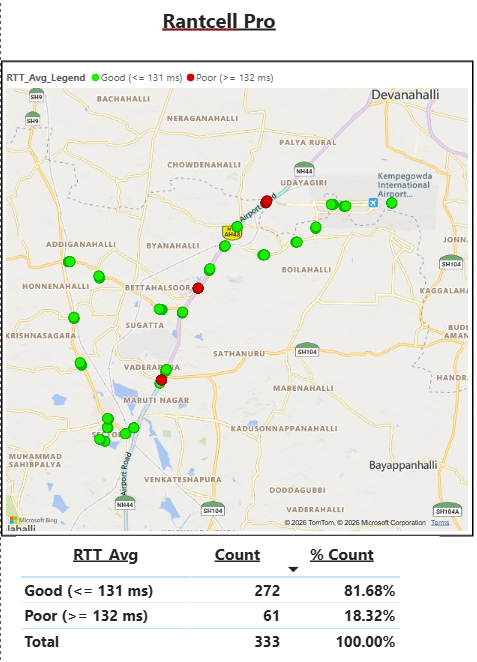
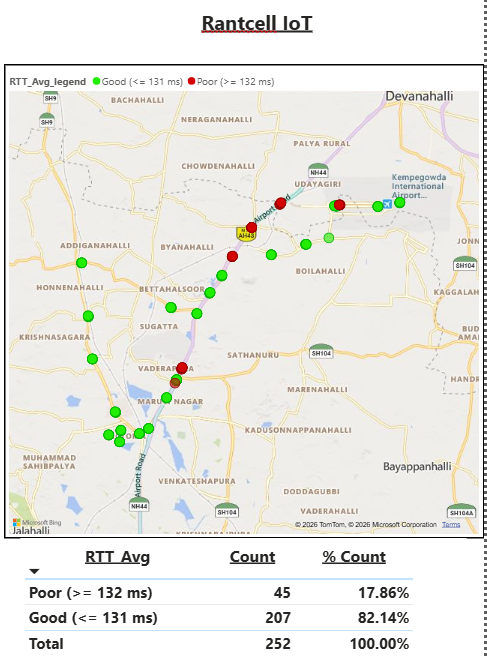
Good RTT (≤ 131 ms): Pro 81.68% of 333 samples, IoT 82.14% of 252.
Pro sampled more densely; IoT reported marginally fewer poor-latency events.
Both platforms demonstrate consistent RTT performance along the route.
Download Speed
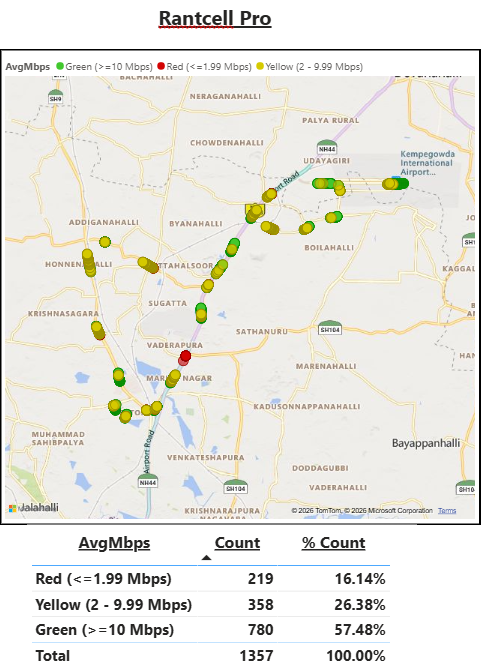
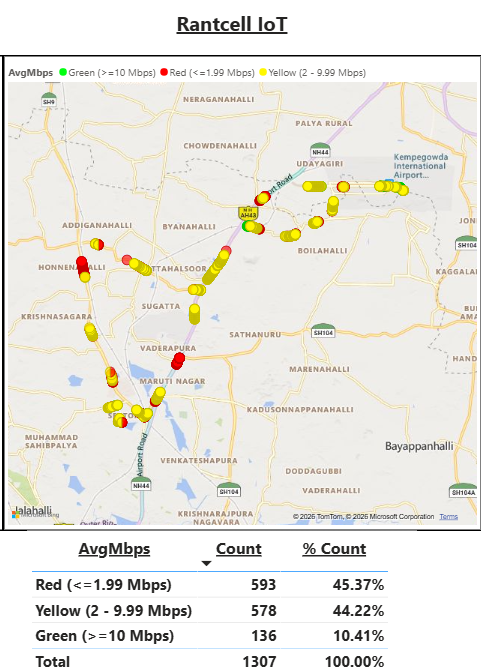
Good download (≥ 10 Mbps): Pro 57.48%, IoT 10.41%.
Low download (≤ 1.99 Mbps): Pro 16.14%, IoT 45.37%.
The largest gap between platforms observed in this study.
Upload Speed
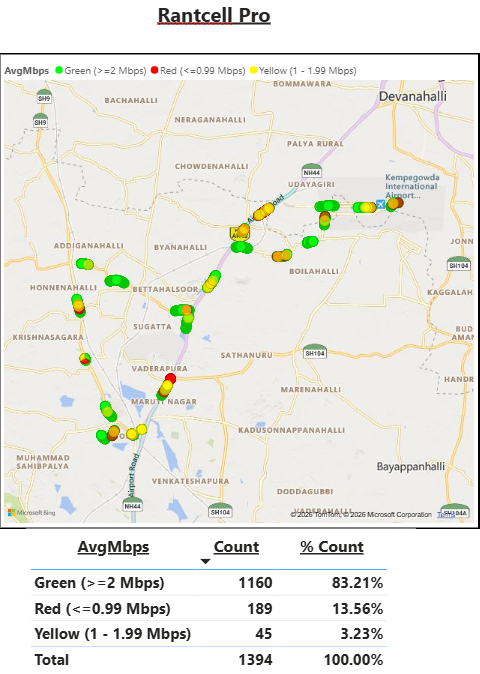
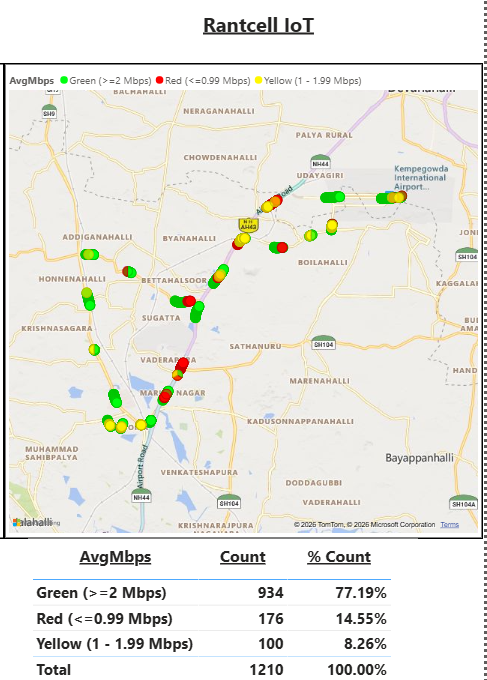
Good upload (≥ 2 Mbps): Pro 83.21%, IoT 77.19%.
Low upload (≤ 0.99 Mbps): Pro 13.56%, IoT 14.55%.
Both platforms provide reliable upstream performance.
Smartphone vs. CPE: where each performs better, and why
| Metric | Pro (Smartphone data) | IoT (CPE data) |
|---|---|---|
| LTE network generation | 100% | 100% |
| Good RSRP | 69.53% | 75.77% |
| Average / Good RSRQ | 7.64% | 0.34% |
| Good SNR | 9.12% | 11.24% |
| Good RTT (latency) | 81.68% | 82.14% |
| Good download (≥10 Mbps) | 57.48% | 10.41% |
| Good upload (≥2 Mbps) | 83.21% | 77.19% |
The CPE's external antennas give it a cleaner radio path than a phone's built-in antenna — hence higher RSRP and SNR. RSRQ stays poor on both, since it reflects tower-side loading, not the device.
The phone's modem held LTE+ (carrier aggregation) most of the route, while the CPE stayed on plain LTE — hence its lower download speeds. Latency is nearly identical, since it depends on the network path, not the device.
Let's Talk About Your Setup
Want details of 4G/5G CPE router and smartphone models we can support?
Want to replicate this setup on your own network or route?
Are you evaluating CPE for a fixed-wireless or private network deployment?
Curious how these KPIs would look across multiple operators or sites?